Customer Marketing Strategy: The Friction Model
You have probably heard or read references to the
“portfolio” approach to managing customers and their value.
I think it’s a sound idea and one I have used over the years
because it’s generally quite easy to understand in theory,
though the actual implementation is always left for you to
figure out on your own. So we’re going to take a look at
this portfolio approach for managing customers and I am
going to supply you with the implementation tools you need
to actually make it work. This is an important chapter,
because understanding these concepts will provide you with
the very foundation needed for developing all of your
Data-Driven marketing campaigns and programs.
The general idea behind the portfolio approach to customer
value management is this: your customer base is a business
asset. Businesses can have lots of different assets, for
example, real estate holdings, buildings, inventory, and
common stock, along with other financial instruments. Each
of these assets has a value to the business. This
collection of assets is an “asset portfolio,” just as you
may hold your own personal portfolio of stocks.
The assets in a portfolio have a current value, which is
what they can be sold for today. As we know, there can be
changes in the current value of an asset portfolio over
time, as what you can sell assets for changes almost daily.
Assets also have an “expected” or future value, which can
be rising or falling as well, depending on the market for
an asset and the type of asset it is. For example, real
estate generally appreciates in value over time, but
machinery generally declines in value over time. This
means at any point in time, an asset has a current as well
as a potential or future value.
The customer base can be viewed as such an asset as well,
and in fact, each customer has a current and a potential
value. The current value is whatever the customer has
created in value for the business as of today. Current
value could be the cumulative profits for the customer
since they became a customer, or the cumulative advertising
value of all the visits made to a web site since the first
one. Potential value is the future stream of profits
expected from the customer as long as they continue to be
a customer. If the customer terminates the business
relationship, the potential value of the customer drops
to near zero; this is the end of the customer LifeCycle,
the defection by the customer. The sum of Current Value
and Potential Value is equal to the LifeTime Value of the
customer; it’s the Total Value contributed by the
customer to your business.
If customers in your customer portfolio have both
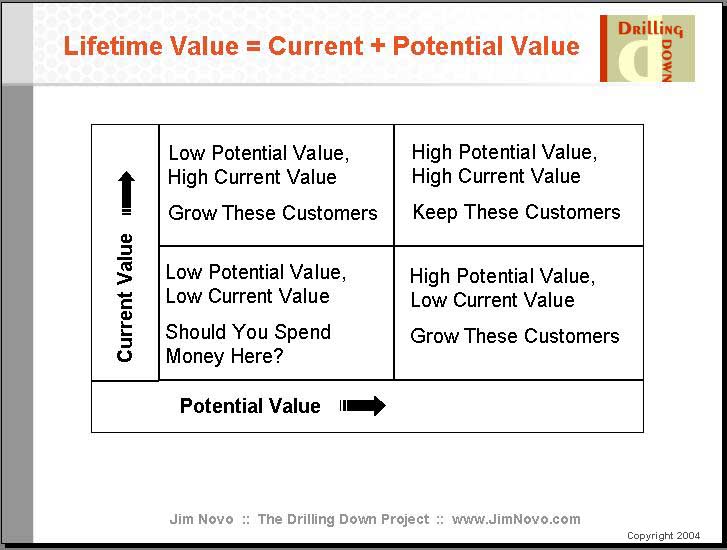
current and potential value, then you can set up a 2 X 2
chart describing the value of your customer base in terms
of current plus potential value (LifeTime Value):
(click the link below to see chart)

Figure 1: The Customer Value Portfolio
Customers having both high current value and high potential
value (upper right corner of chart) are the “rocket fuel”
customers; these are the 10% – 20% of your customers
generating 80% – 90% of your profits. You very much want
to keep these customers and should be paying special
attention to keeping them happy; these are your best
buyers, heaviest visitors, and so forth.
In the lower left corner of the chart, you have the
opposite situation; these customers have low current and
low potential value. This group probably includes most
of your 1X buyers, accidental visitors to the web site,
and so on. For the most part, though it’s nice to have
these customers and they perhaps contribute to paying
overhead costs, you probably should not go out of your way
to spend a lot of resources trying to grow their potential.
In fact, this group likely contains every customer you have
already spent too much money marketing to – those that
never respond. This is also the group customer “win back”
programs often focus on.
The upper left and lower right corners of the chart hold
customers with a mix of current and potential values. In
the upper left, you have high current, low potential value
customers. This area is populated mostly by defecting best
customers – they were best customers at one time (by
current value) but for whatever reason have slowed their
profit-generating activity with you and are probably
destined to fall into the lower left corner of the chart by
defecting. If you’re smart, you’ll come up with programs
that drag them back across to the upper right corner.
Customer retention programs should be focused on this
group, but more often than not, are not really focused on
any group in particular, and that is why they have a
high failure rate.
In the lower right corner, you have customers with high
potential value and low current value. Who are these
people? It’s likely they are fairly new customers who
have not had a chance to create a lot of value for you yet,
but are expected to create value in the future. If they
do, they will rise into the upper right hand corner of the
chart and become “rocket fuel” customers. If they don’t,
they will fall back across the chart into the lower left
corner and contribute very little. Customers in this
corner should be the targets of programs designed to
increase customer value, though as with the retention
programs mentioned above, these “grow the customer”
programs are often not focused on this specific group
and tend to actually lose a lot more money than they make.
That’s the portfolio approach to managing customers and
their value, or at least my definition of it. There are
others, which for the most part use lifestyle or
demographic metrics to allocate the customers. But we’re
on to that charade, right? Demographics tell you nothing
about the current or potential value of the customer, and
if you’re in a real business, what you care about is the
money. For this reason, my approach uses actual spending
or value-generating behavior to allocate customers into the
quadrants of the customer portfolio.
You say, “Yea, but wait a minute Jim, you’re pulling a fast
one here. I get how current value is derived, I mean, it’s
the actual transactional value of the customer – sales,
visits, whatever behavior is monetized by the business.
But how do you do this “potential value” allocation, how do
you measure potential value? I guess future behavior will
create value in the future, but how do I measure behavior
that has not happened yet? What kind of behavior indicates
the potential value of the customer? I was with you until
now, but this idea sounds…”
Relax. Can you take the pebble from my hand, grasshopper?
When you can take the pebble from my hand, it will be
time for you to leave.
If you didn’t get the reference above, you’re not up on
your 70’s TV shows. Try a web search on “pebble
grasshopper Kung Fu” if you really need to know.
But you are right. This whole potential value measurement
issue is, of course, the big problem embedded in the
preaching you hear on LifeTime Value, CRM, and these
portfolio models of customer value. How do you deal with
this whole “potential value” question, how do you actually
measure it and act on it?
Well, fellow Driller, would it surprise you to learn that
the specific answers to those questions are what the rest
of this book is about? I’m not going to give you a
conference lecture about all these wonderful things you
should be doing with customer value management and then not
tell you how to actually do them. Oh no. You will find
out exactly how to measure potential value, and as a bonus,
you will be surprised how easy it is. In fact, there are
specific metrics for potential value and you will learn
what they are and exactly how to use them.
Recall this passage from the previous chapter:
It’s not nearly as important to know the absolute or exact
value of a customer as it is to know whether this value is
rising or falling over time. Customer behavior also
changes over time, and these changes in behavior typically
precede a change in customer value. That means if you
track these changes in behavior, you can forecast a change
in value, and if you can forecast a change in value, you
can get your campaign or program out there and do something
about it. This is the core idea behind Relationship
Marketing, and these changes in customer behavior and value
over time are called the Customer LifeCycle.
So the following may not surprise you: there are LifeCycle
Metrics you can use to forecast future changes in value by
tracking behavior in the present.
Pretty handy, huh? And just in time, it seemed like you
were getting kind of unruly…
These LifeCycle metrics are where the idea of Friction
comes into play. They measure Friction so that you can
track and manage it. And if you can track and manage
Friction, you can actually put the concept of the customer
portfolio management from above into action.
Friction is really about the likelihood a customer will
continue to do business with you. The actual causes of
friction are created on the business side, and manifest
themselves on the customer side as impatience, frustration,
and lack of loyalty. Customers encounter varying degrees
of this friction in their business relationships, and
become more or less likely to do business with you as this
friction changes. They already have low tolerance for poor
customer service, processes that don’t work as they should,
pricing that changes unexpectedly or is confusing,
interfaces that make it difficult to accomplish tasks,
communications that are sloppy, not delivered in a timely
way, or irrelevant. All of these friction points tend to
create increasing levels of frustration and ill will, which
over time mutate into dissatisfaction and defection.
Friction accumulates to the point the customer simply
decides to start seeking alternatives, and once
alternatives are found, the customer terminates the
prior business relationship.
Now, none of this may sound new to you, but here is
something that is new. The friction effect is especially
true and is more pronounced as “customer control” of the
business relationship increases. Customers are demanding
and taking more control of business relationships
themselves, as is true with web retail, or have been forced
to take control, as with the practice of pushing customers
to serve themselves though the web or a telephone interface.
As the ability for the customer to exert control in the
business relationship increases, customers become less
and less tolerant of friction.
And, as friction rises, the customer becomes less and less
likely to do business with you in the future. If a
customer is becoming less and less likely to do business
with you, the value you could realize from the business
relationship with the customer in the future has
to be falling.
In other words:
Rising friction = falling potential value;
Falling friction = rising potential value
So, if you can measure friction, you can measure
potential value. And measuring friction is exactly what
LifeCycle Metrics do. By measuring friction, these metrics
also measure the likelihood of a customer to do business
with you in the future, and so also measure the potential
value of the customer. Visitors and customers will
“signal” their friction levels through their own behavior;
LifeCycle Metrics organize and codify this behavioral data
for you, and allow you to create reports and trip wires
that flag increasing or decreasing friction.
And how do you reduce friction? By applying the grease, my
fellow Driller – your innovative selling and service
campaigns are the grease that will hopefully reduce
friction and increase the potential value of the customer.
Fortunately, you will have your LifeCycle Metrics to tell
you precisely who needs the grease, when it should be
applied, and even when it should be applied a second time.
Your potential value metrics will also tell you when your
relationship with the customer has already “seized up” and
it’s too late for the grease. You only have so much grease
and the grease is expensive, so you want to apply it only
when and where you think it is likely you can reduce
friction and prevent the relationship from seizing up.
By the way, customers are not the only folks who experience
friction, people trying to become customers experience it
also. An easy way to measure this want-to-be-a-customer
friction is to look at the visitor conversion rate on your
web site. Navigational design and layout determine
“physical” friction and copy elements determine “emotional”
friction. Design and layout testing will reduce physical
friction; persuasive copywriting will reduce emotional
friction. Success at reducing want-to-be-a-customer
friction is measured by an increased rate of visitor
conversion to goal on the web site.
But back to customers. With our first LifeCycle Metrics,
Latency and Recency, we’re going to be looking at the
tracking of potential value only, and how you can use
changes in potential value to trigger High ROI Customer
Marketing campaigns or programs. After the Latency and
Recency metrics we will cover the RFM model, which uses
both Current Value and Potential Value metrics to really
uice up your results and drive even higher profits to the
bottom line of your company.